
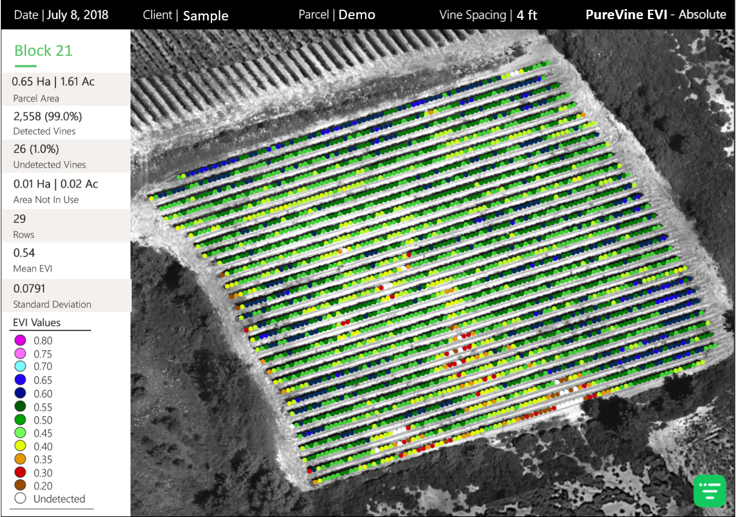
Figure 1: PureVine EVI map with row, zone, and block stats
PureVine was designed with actionability in mind – we want our data products to help growers make better management decisions.PureVine takes advantage of the ultra high-resolution images we collect and applies this information to individual vines. Before final analysis, all soil and cover crop data are removed to ensure we are only measuring the canopy. This data is then used to calculate quantifiable statistics at the row, zone, and block level.
When generating PureVine, the information growers provide about vine spacing is used to ensure that plant counts are as close to true as possible. Each virtual vine is placed along the row at the exact spacing value that was provided, which allows vine counts to within 5% error of in-field counts. A remaining challenge with aerial imagery of vineyards is that we cannot actually see the vines themselves (depending on the trellis system), but rather the canopy a continuous row. VineView is actively engaged in several research projects to develop new technology that further reduces the error.
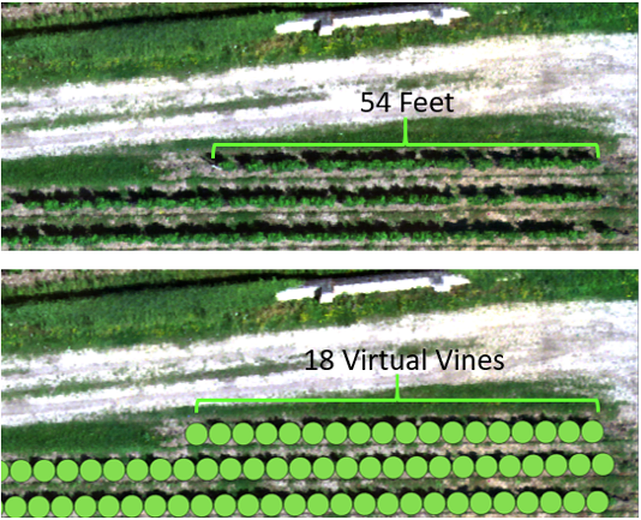
Figure 2: illustration of our proprietary plant counting method. Virtual Vines are added to each row based on the provided vine spacing. In this example, the provided vine spacing was 3 feet, resulting in 18 virtual vines for that row.
By filtering out cover crop and soil from the images, we are able to use PureVine to calculate canopy area for each virtual vine. By comparing the canopy area to that of a ‘small’ vine, we are able to highlight gaps within the rows. We refer to these as undetected vines– although small or young vines could be there, the system does not detect it due to the lack of available canopy.
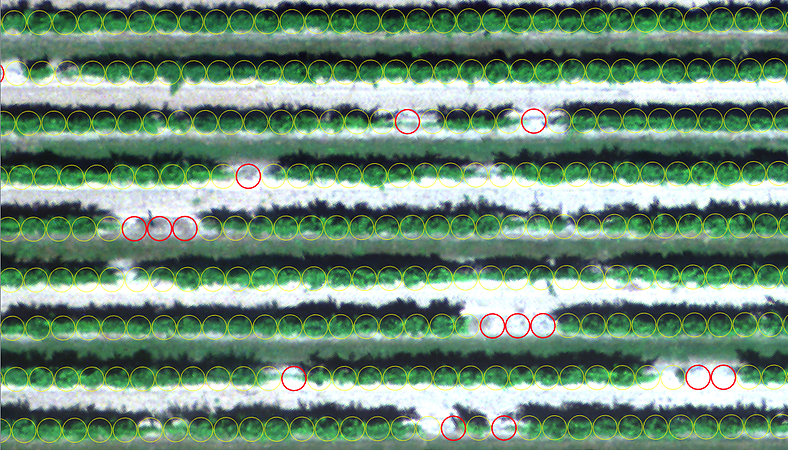
Figure 3: Undetected Vine close up
Within the next few months we will release new ways to present our disease and water content products in the PureVine format. PureVine can help quantify the prevalence and reveal the locations of specific grapevine diseases in vineyard blocks. Using PureVine with our water content data can enable more accurate usage of precision irrigation systems.
The information provided by PureVine is accessible on VineView’s desktop and mobile applications, in our generated map reports, or can be imported into any spreadsheet or GIS software for further analysis.
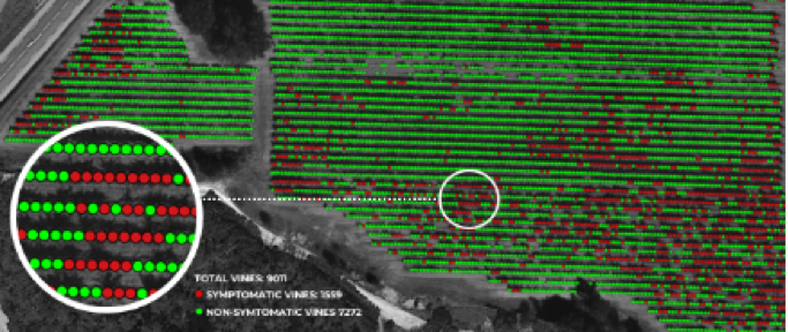
Figure 4: PureVine virtual vines (yellow) with undetected vines highlighted in red


